EnRoute

Air Pollution in Skopje
November 2019
On November 19, I lost my aunt due to the toxic air pollution in Skopje. Since there was a lack of readily
available air quality information, we couldn’t understand where is this pollution coming from. This personal loss drove me to develop a network of affordable
sensors that could provide real-time air quality data to everyone in Skopje.
The information data helped us to understand that fast fashion factories out of town were one of the main cause of the pollution.
EnRoute
First Prototypes, 2021
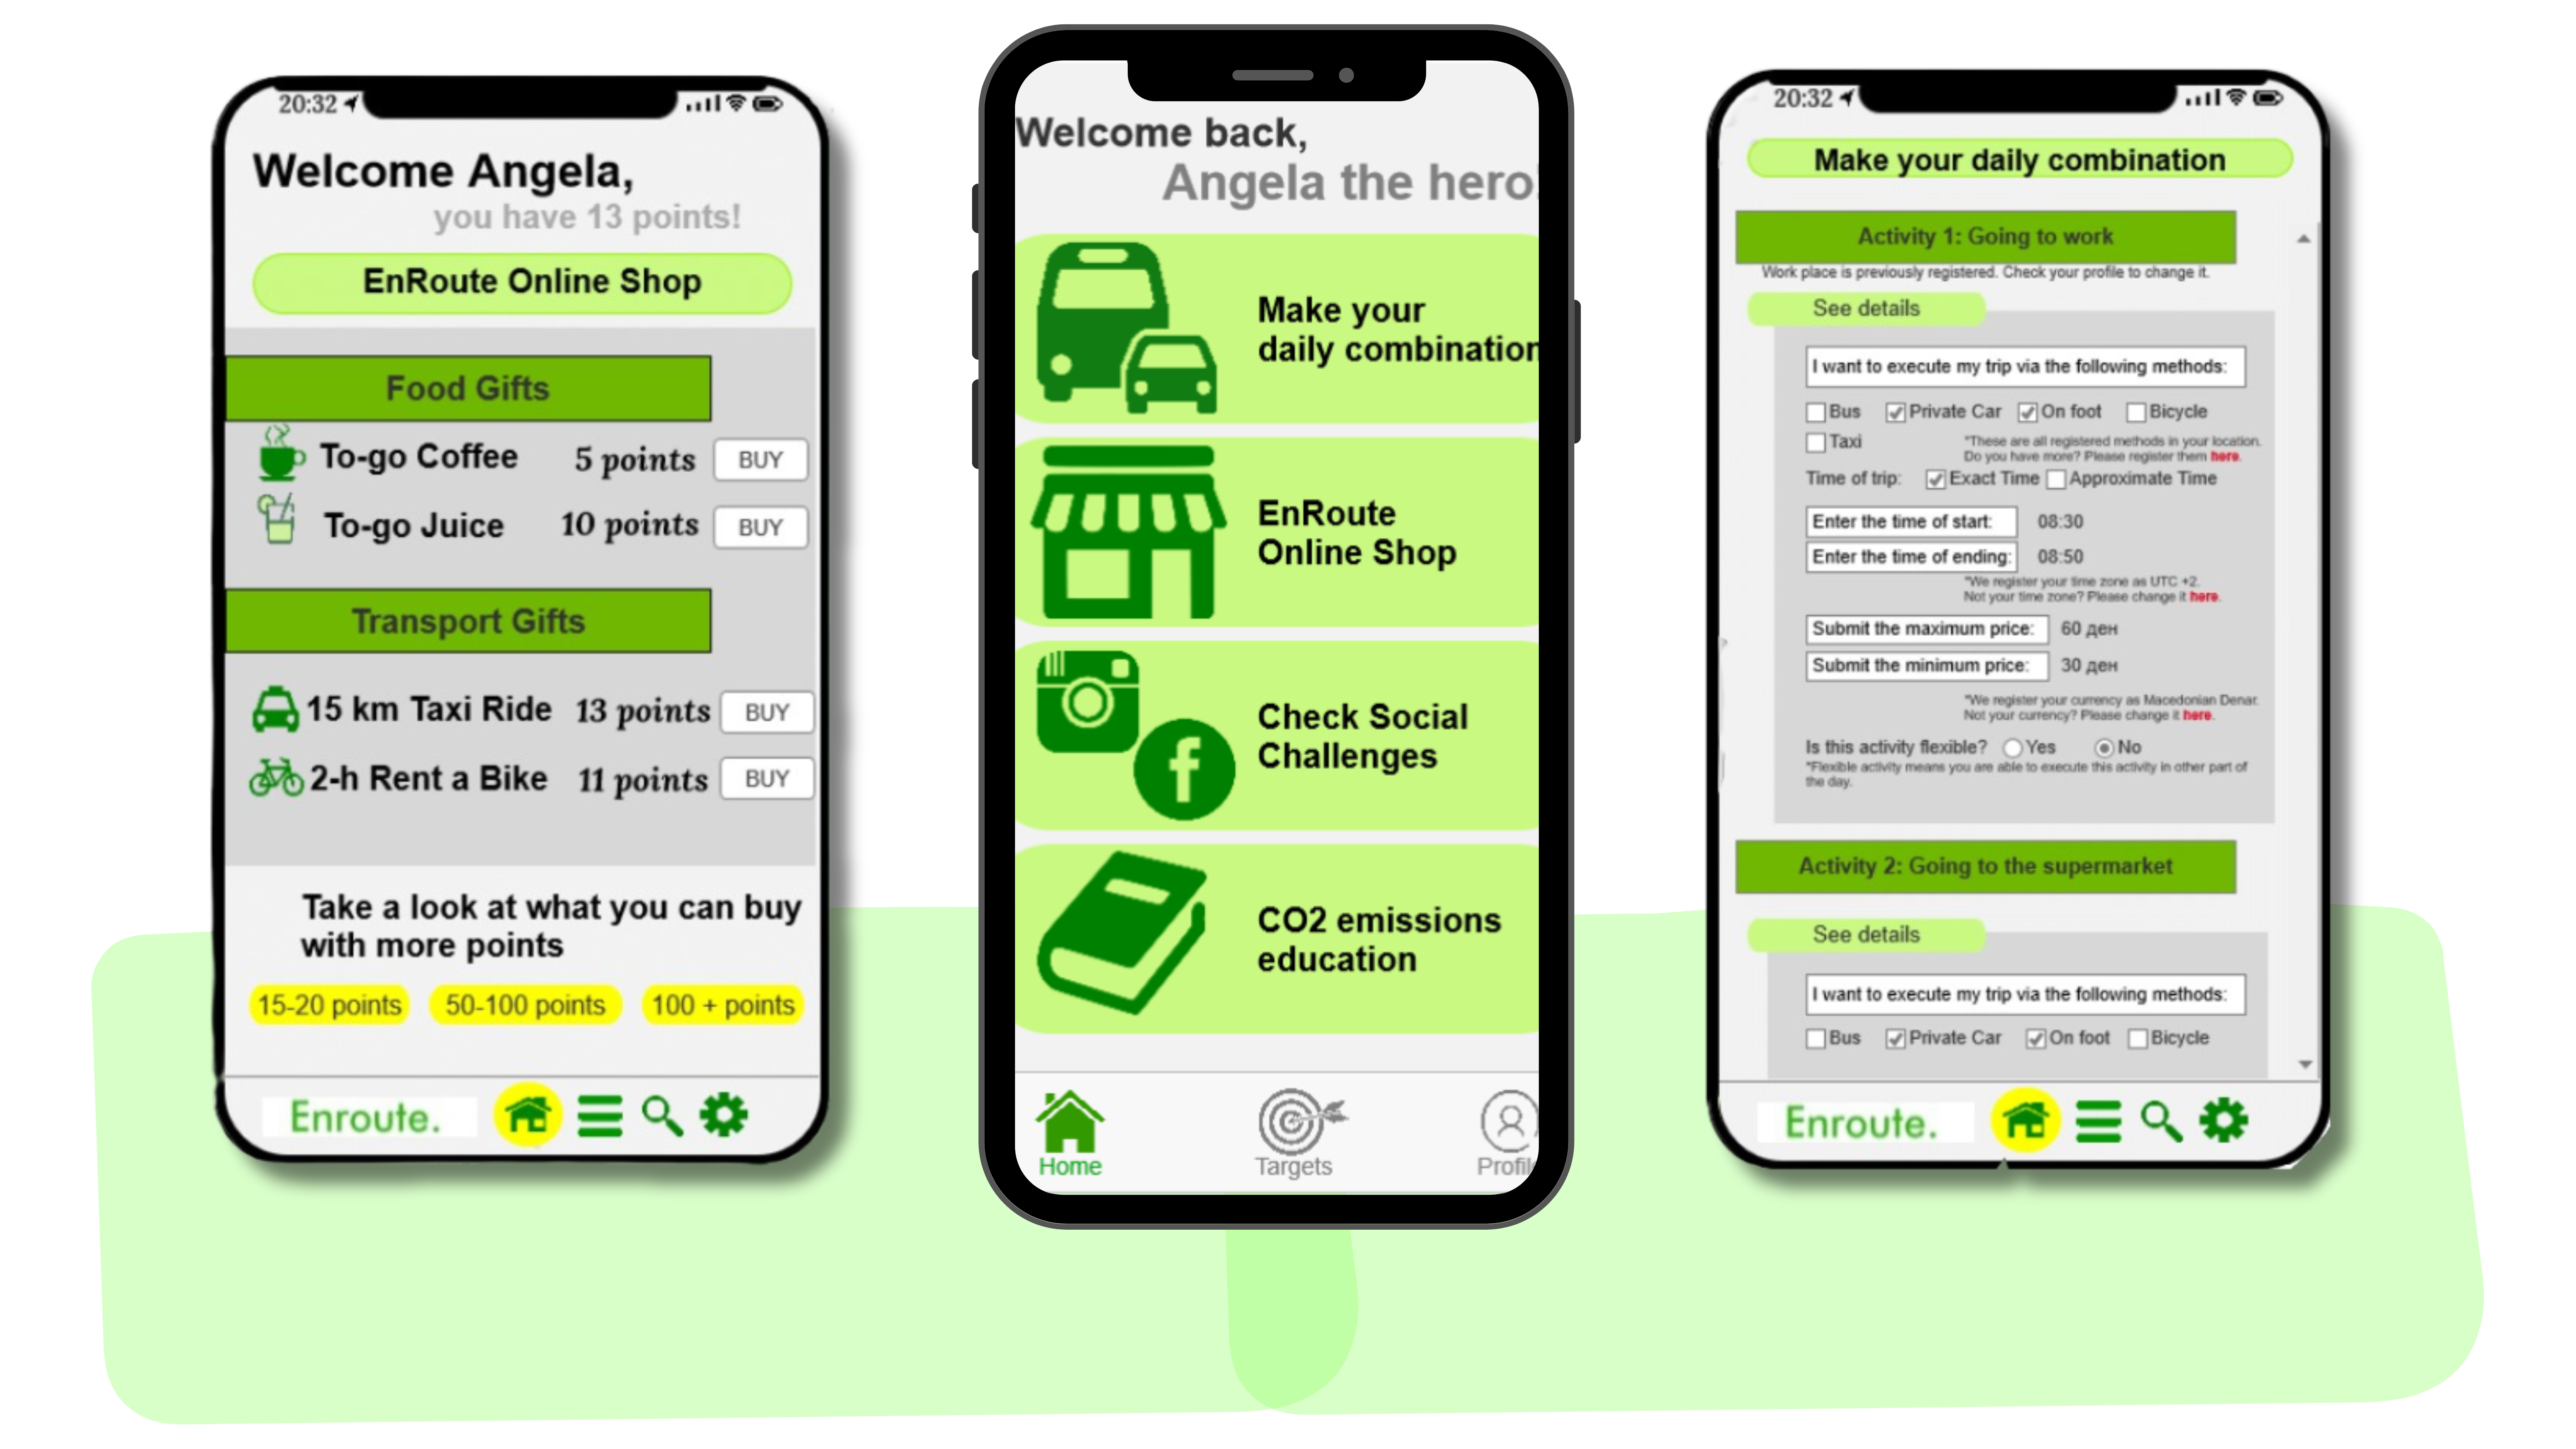
In April 2020, as the world went into lockdown, I developed a concept to measure how much we can offset daily emissions through our shopping activities.
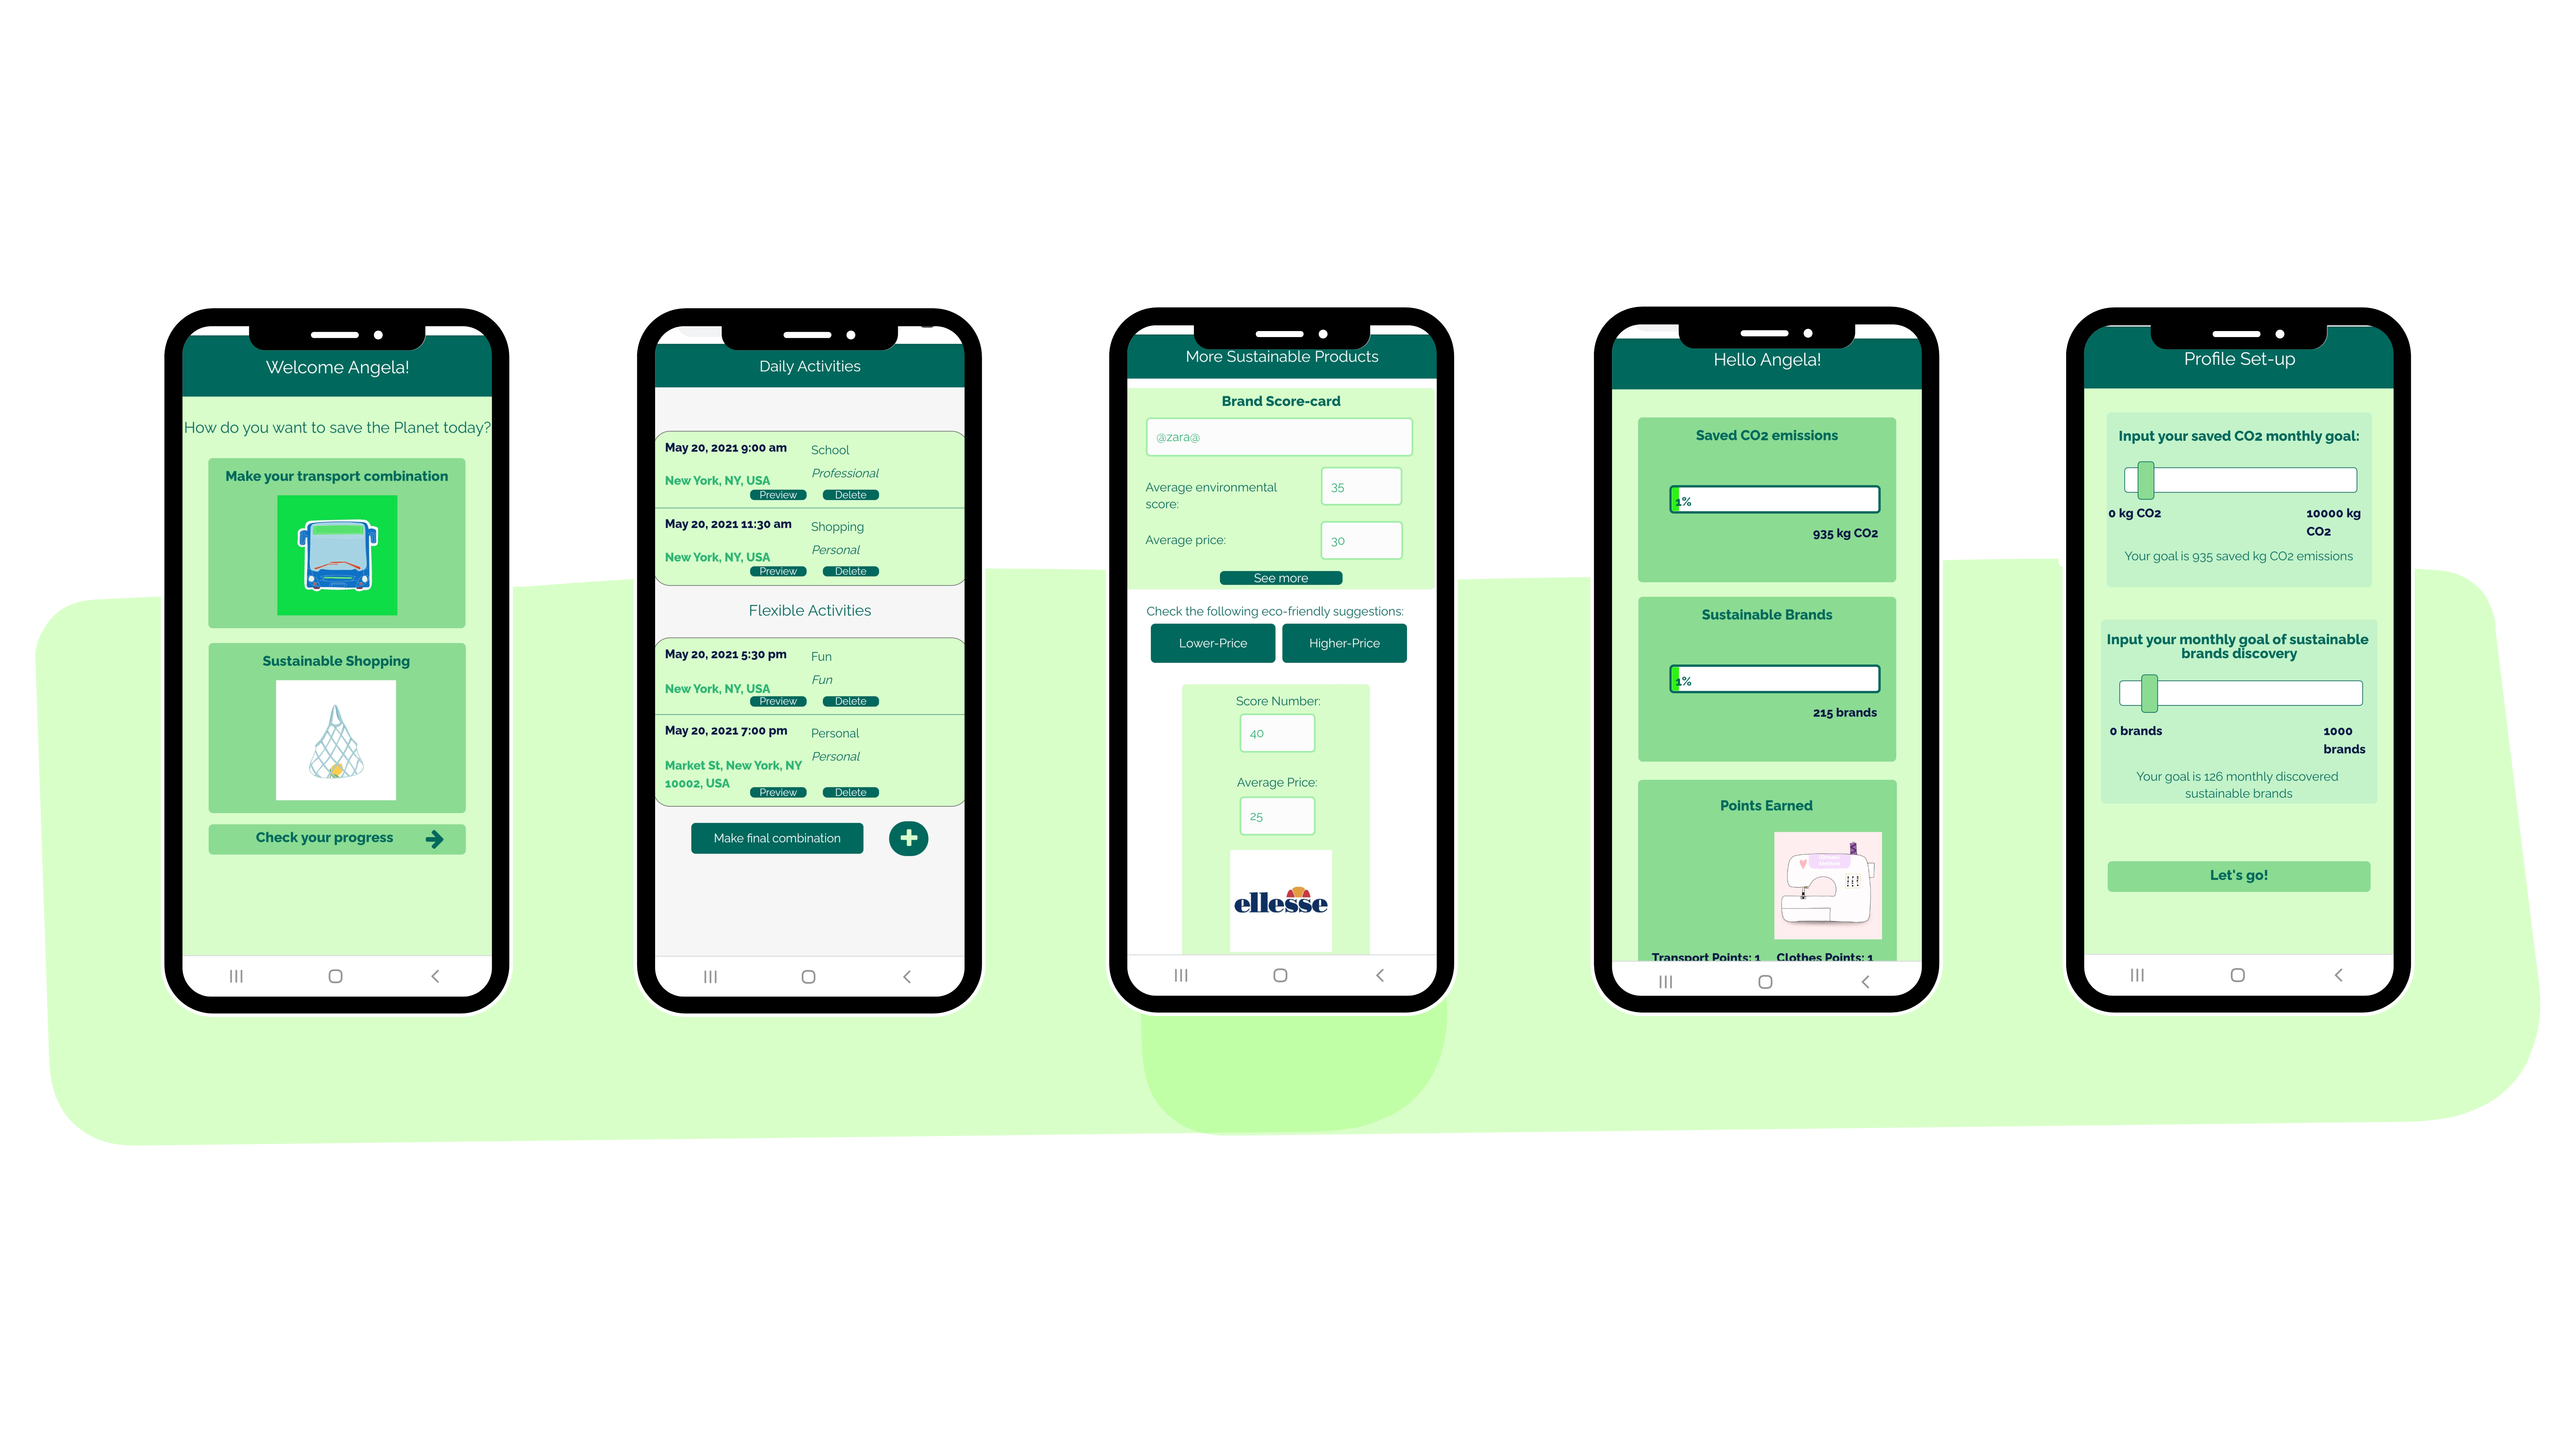
The first app I built, was an app in Android Studio, using Flutter & Dart. It had a single-page app that allows users to input their daily activities and provides a combination of options that minimizes CO2 emissions while respecting their preferences.
In the second version, I partnered with local shops to offer discounts based on users' actions, effectively supporting local businesses while incentivizing users to adopt more sustainable practices.
Sustainable Shopping Solution
App Store Launch, 2022
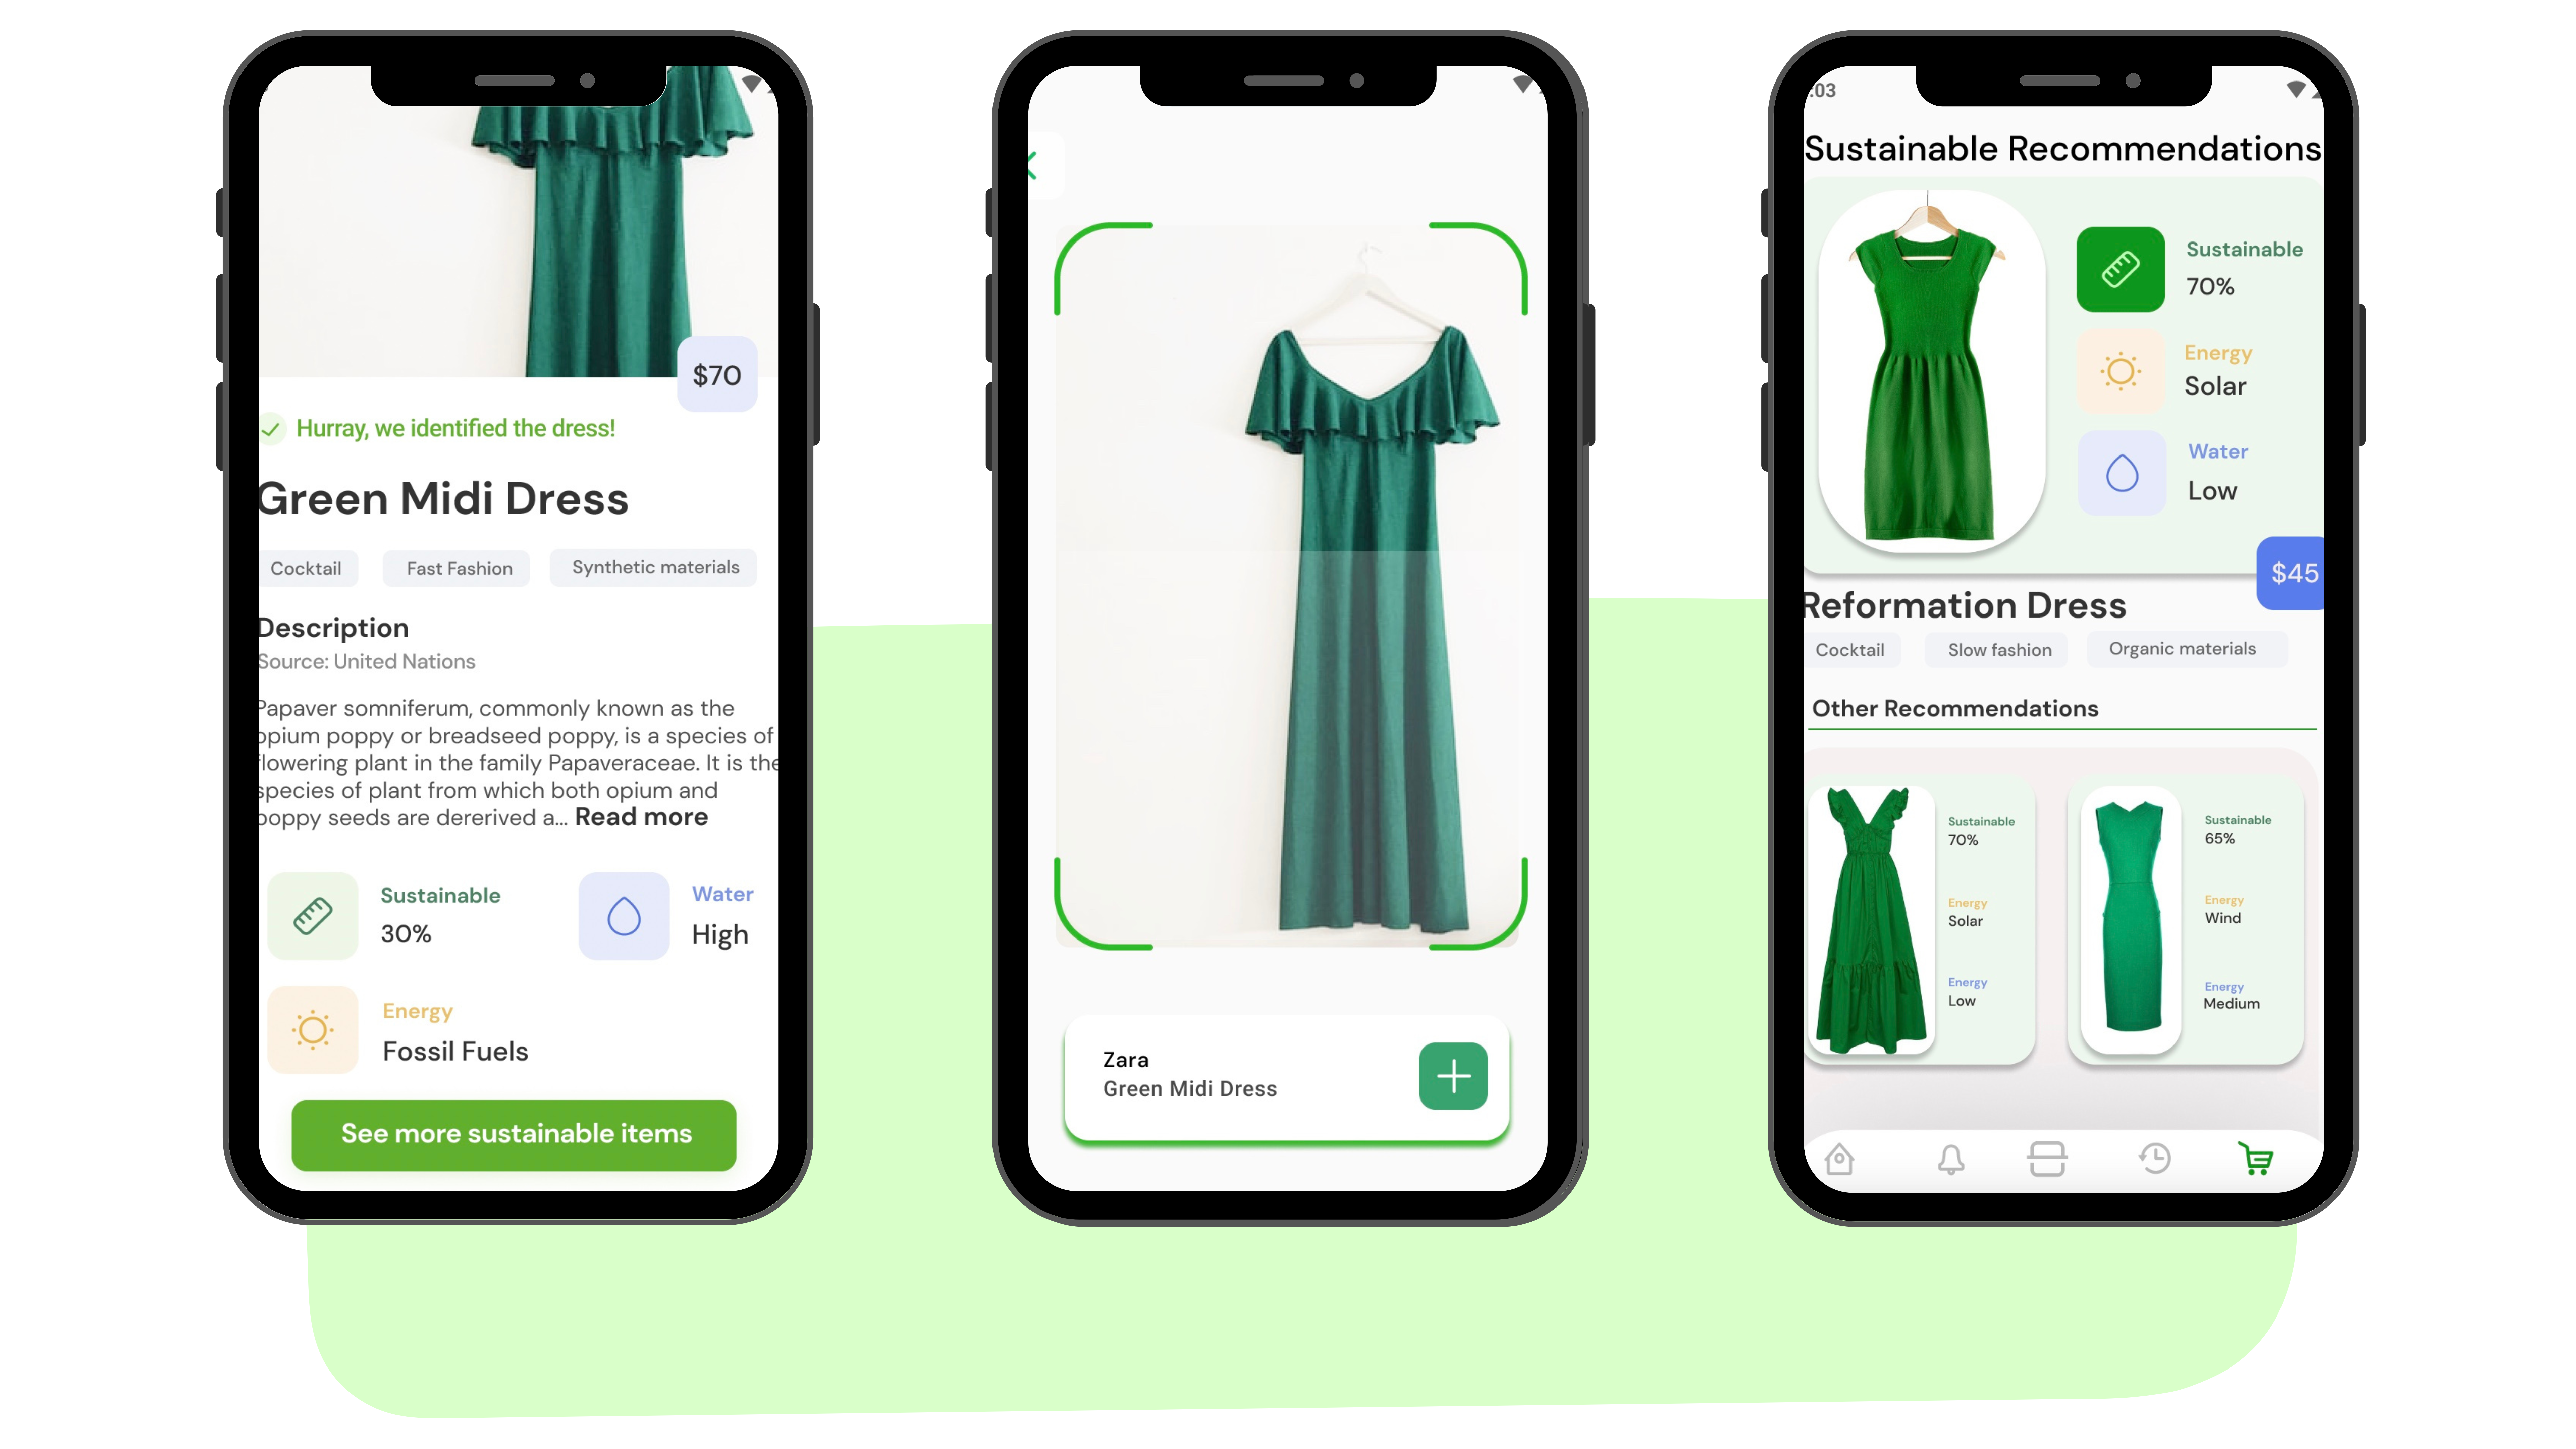
The following version was built with React Native & Swift, the app connected to sensors for predicting air pollution, and analyzed the supply chain of food & fashion products. Reached over 6000 users.
This version features a barcode scanning tool. After scanning, the app provides sustainability insights about the company and recommends alternative brands with better environmental practices. This functionality empowers users to make informed, eco-conscious shopping choices and supports a shift toward more sustainable consumption.
EnRoute Image Recognition
Technical Evolution, 2023
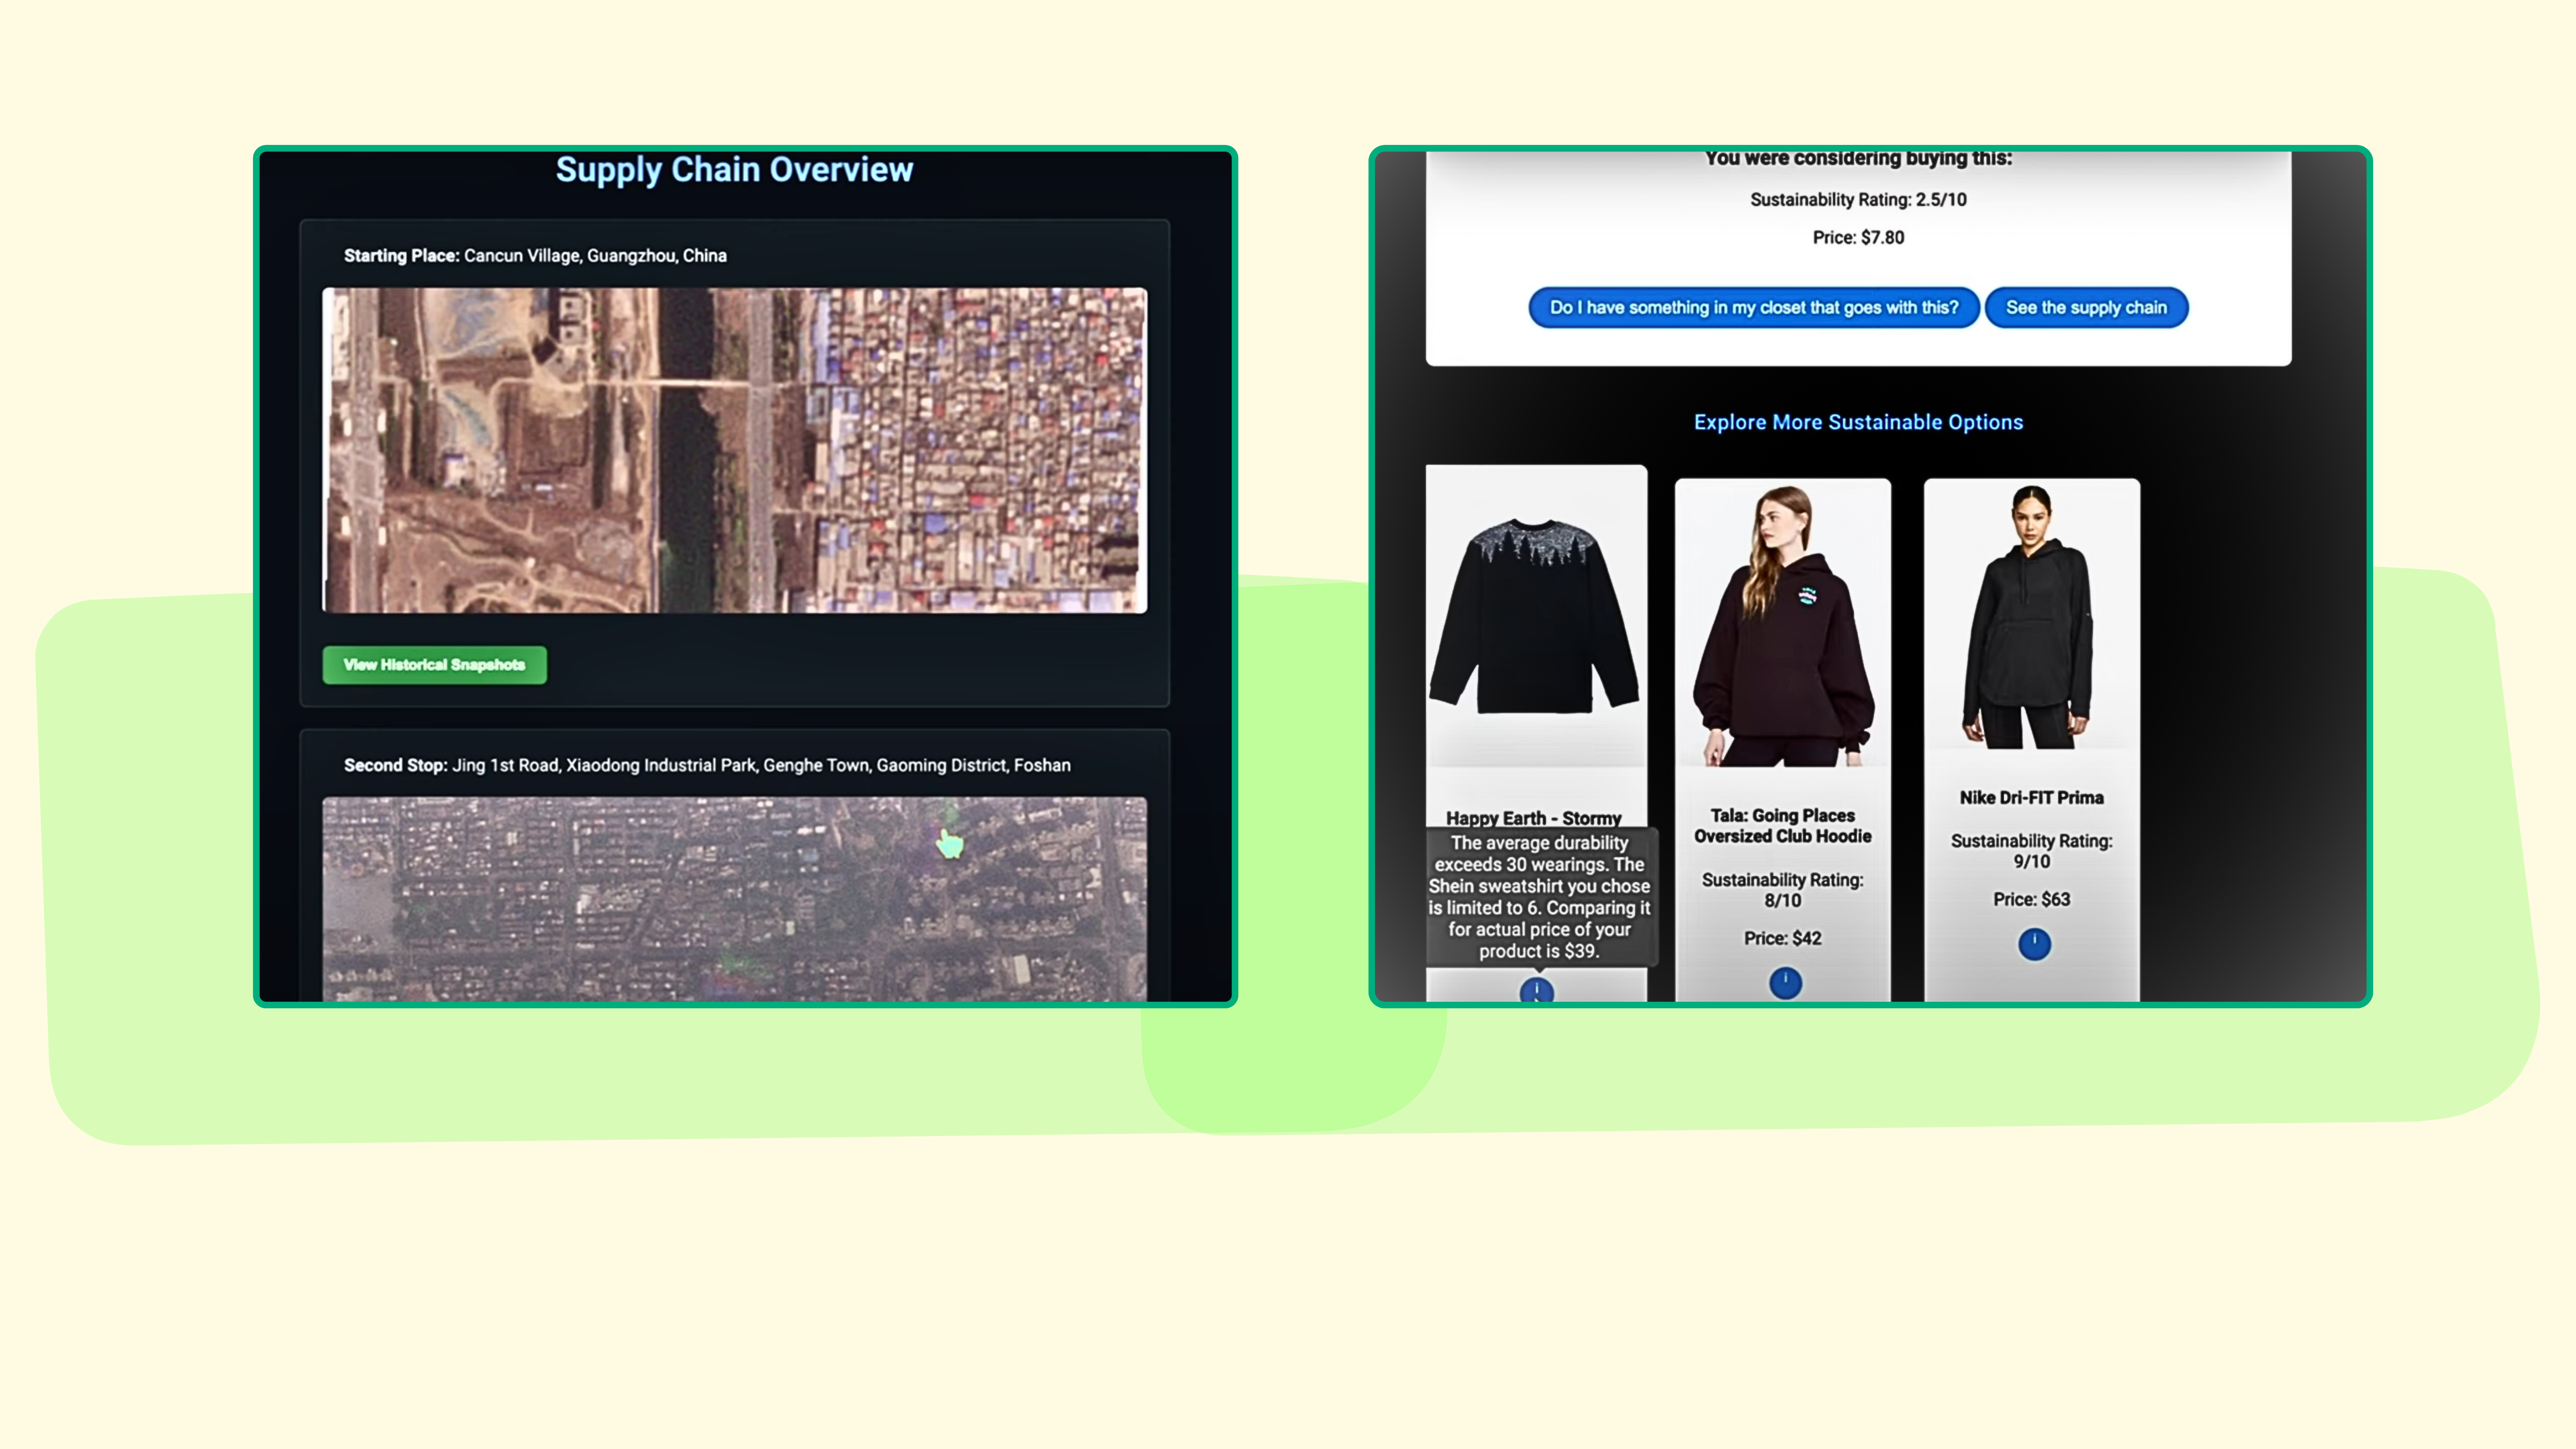
Based on the feedback from the previous version, we realized that users are more interested in understanding the story behind a specific piece rather than a particular company. Therefore, we developed this version using computer vision, recommendation systems, and a specialized sustainability algorithm.
In Stage I, we analyze data from fashion company reports, perform carbon calculations using EPA standards, and classify items based on sustainability using a non-linear regression model for CO2 estimation. In Stage II, we use CNNs for clothing and log detection via computer vision. In Stage III, we build a recommendation system to promote sustainable fashion choices.
Supply Chain Analysis
Expansion, 2024
In response to France's fast fashion ban aimed at mitigating the environmental and ethical impacts of rapid apparel production, I developed EnRoute Supply Chain—a sophisticated system that leverages satellite imagery, AI-driven analytics, and multi-agent coordination to help governments and local agencies monitor product journeys from factory to delivery.
High-resolution satellites track key sustainability metrics such as water usage, emissions, and product durability, directly addressing the challenges posed by fast fashion. Meanwhile, multi-agent systems facilitate real-time communication, automated alerts, and dynamic route adjustments which deliver transparent supply chain management.
Wearables
Wearables
BCI Robot Control
January, 2023
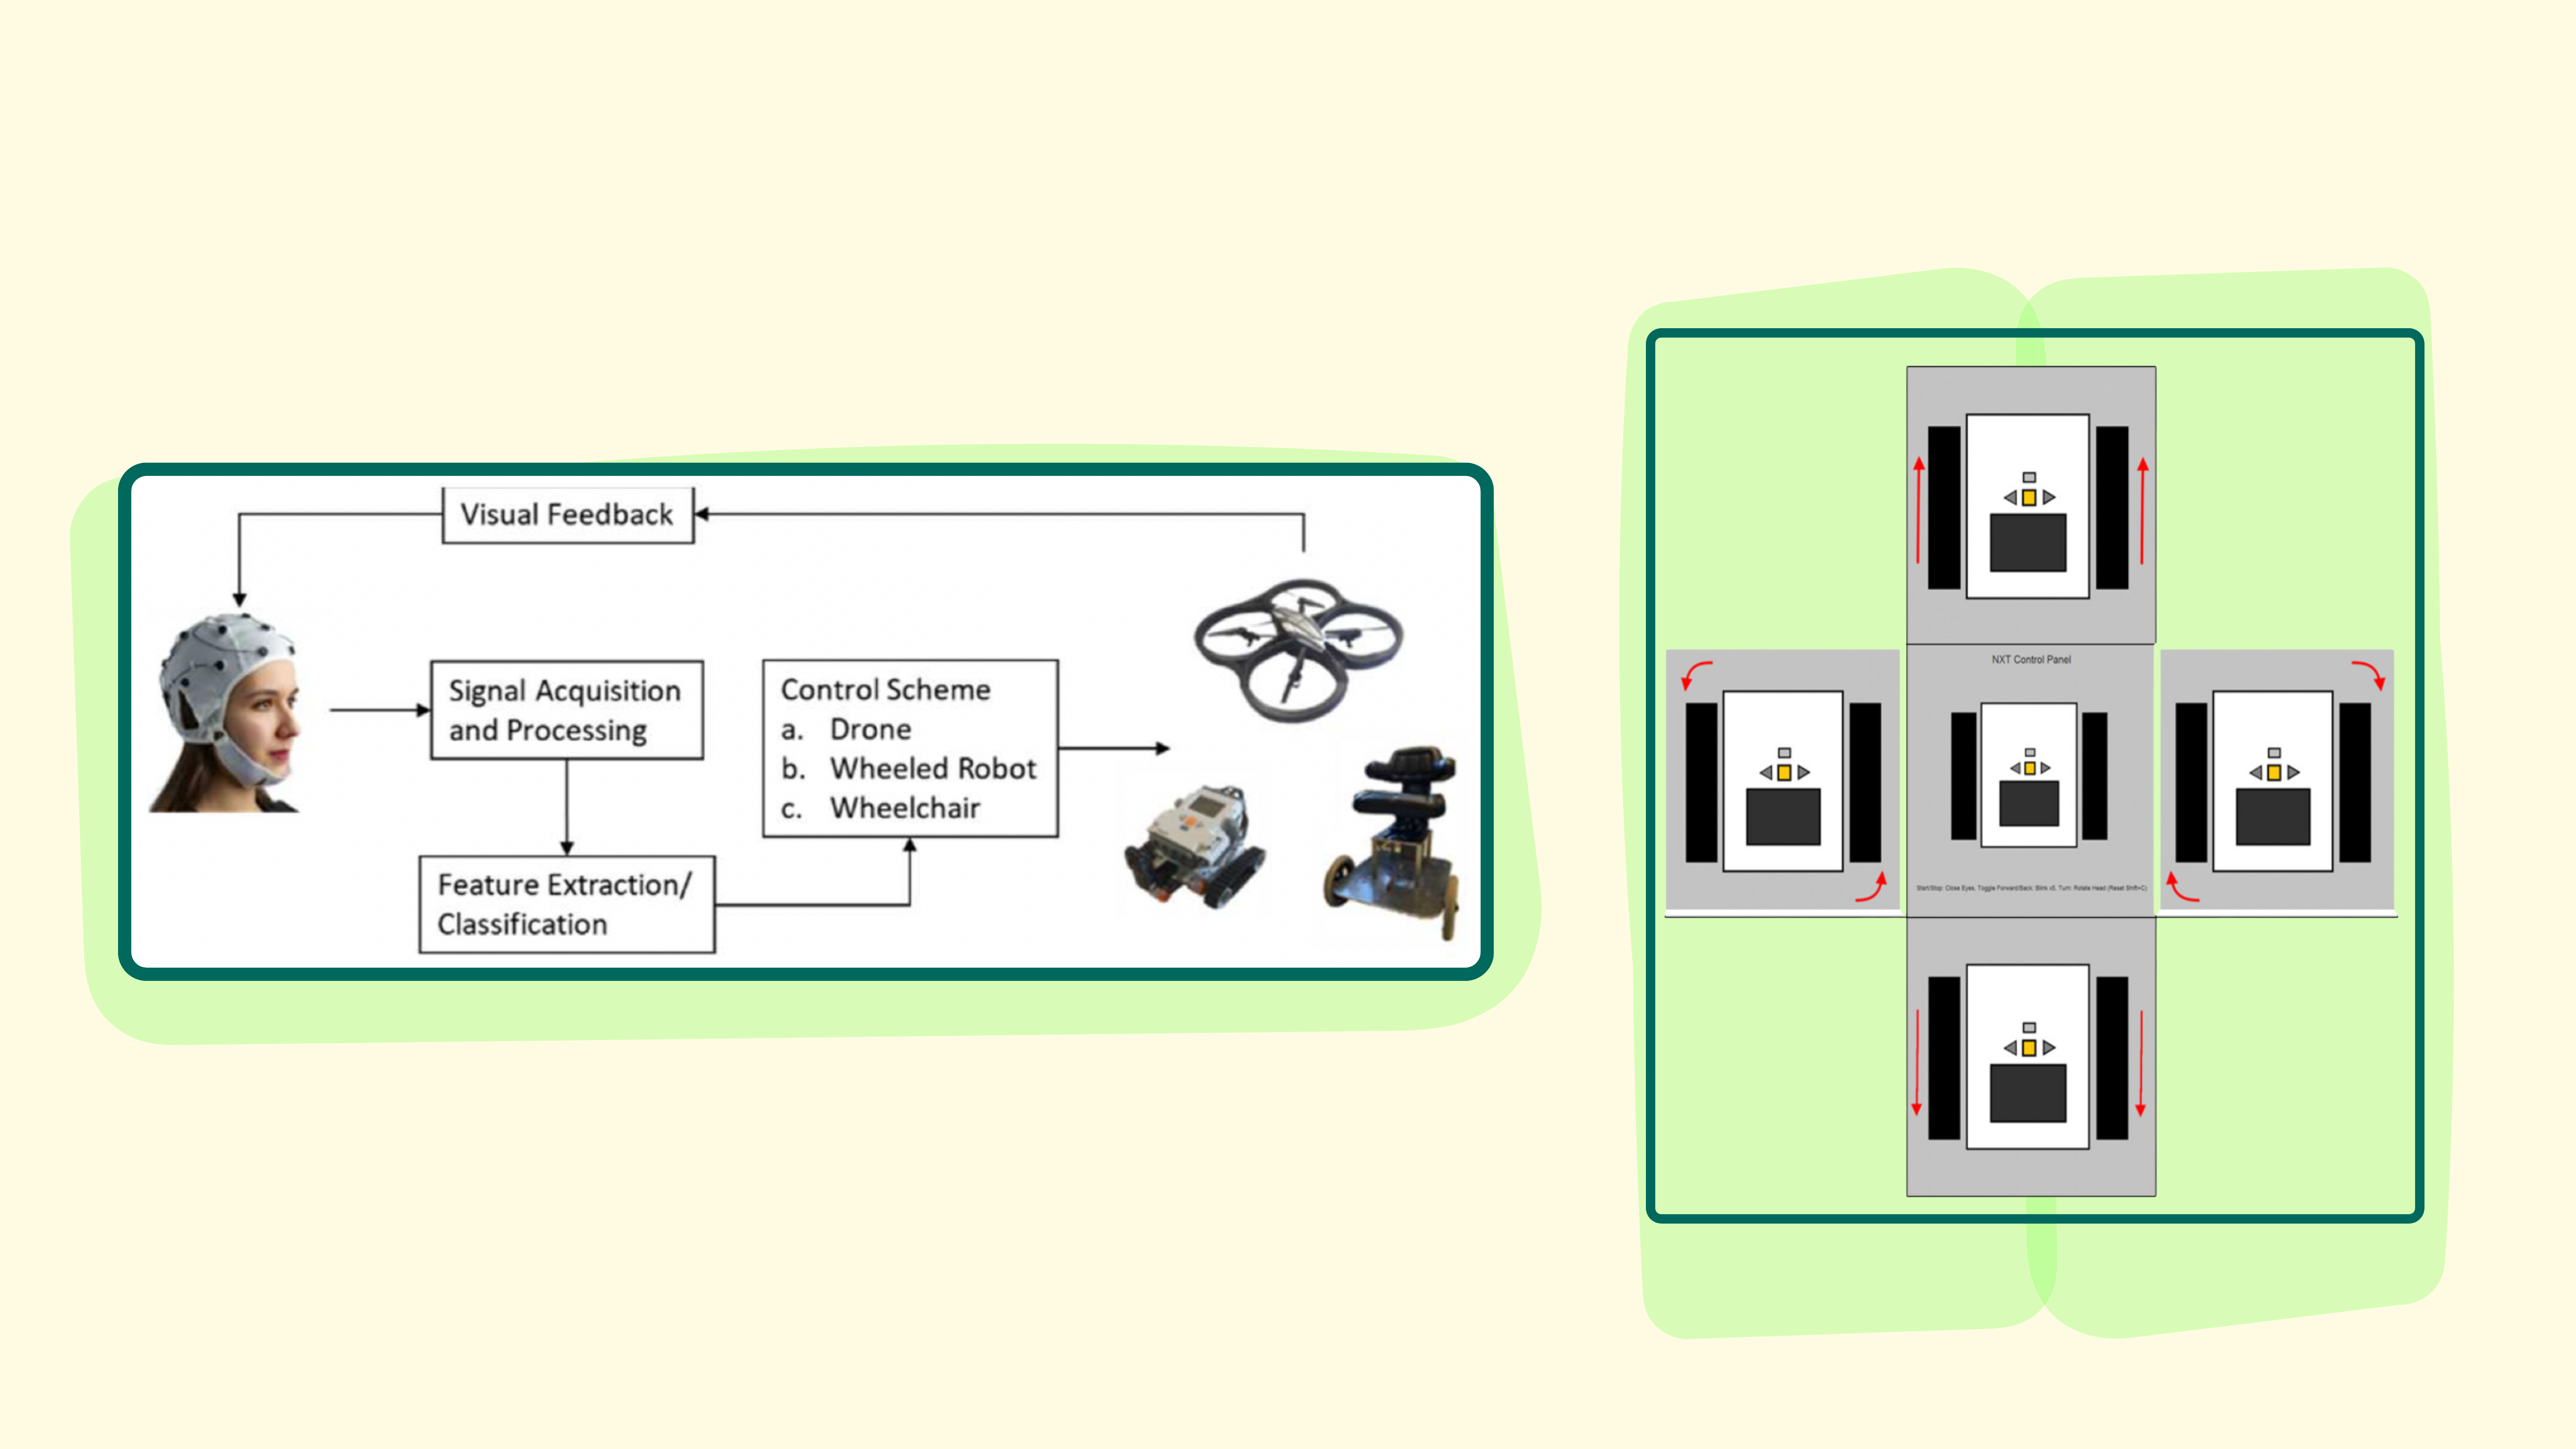
The hybrid Brain-Computer Interface (BCI) system enables control of robotic devices like drones, wheeled robots, and wheelchairs using EEG and EMG signals. Neural activities and muscle artifacts are captured via an EEG cap, processed, and classified with algorithms to interpret user intent. These signals are then translated into control commands for the robotic device.
Real-time visual feedback allows users to monitor the device's state, such as speed and direction, which enables precise navigation through a continuous feedback loop.
BCI Motor Imagery
Signal Processing, September 2023
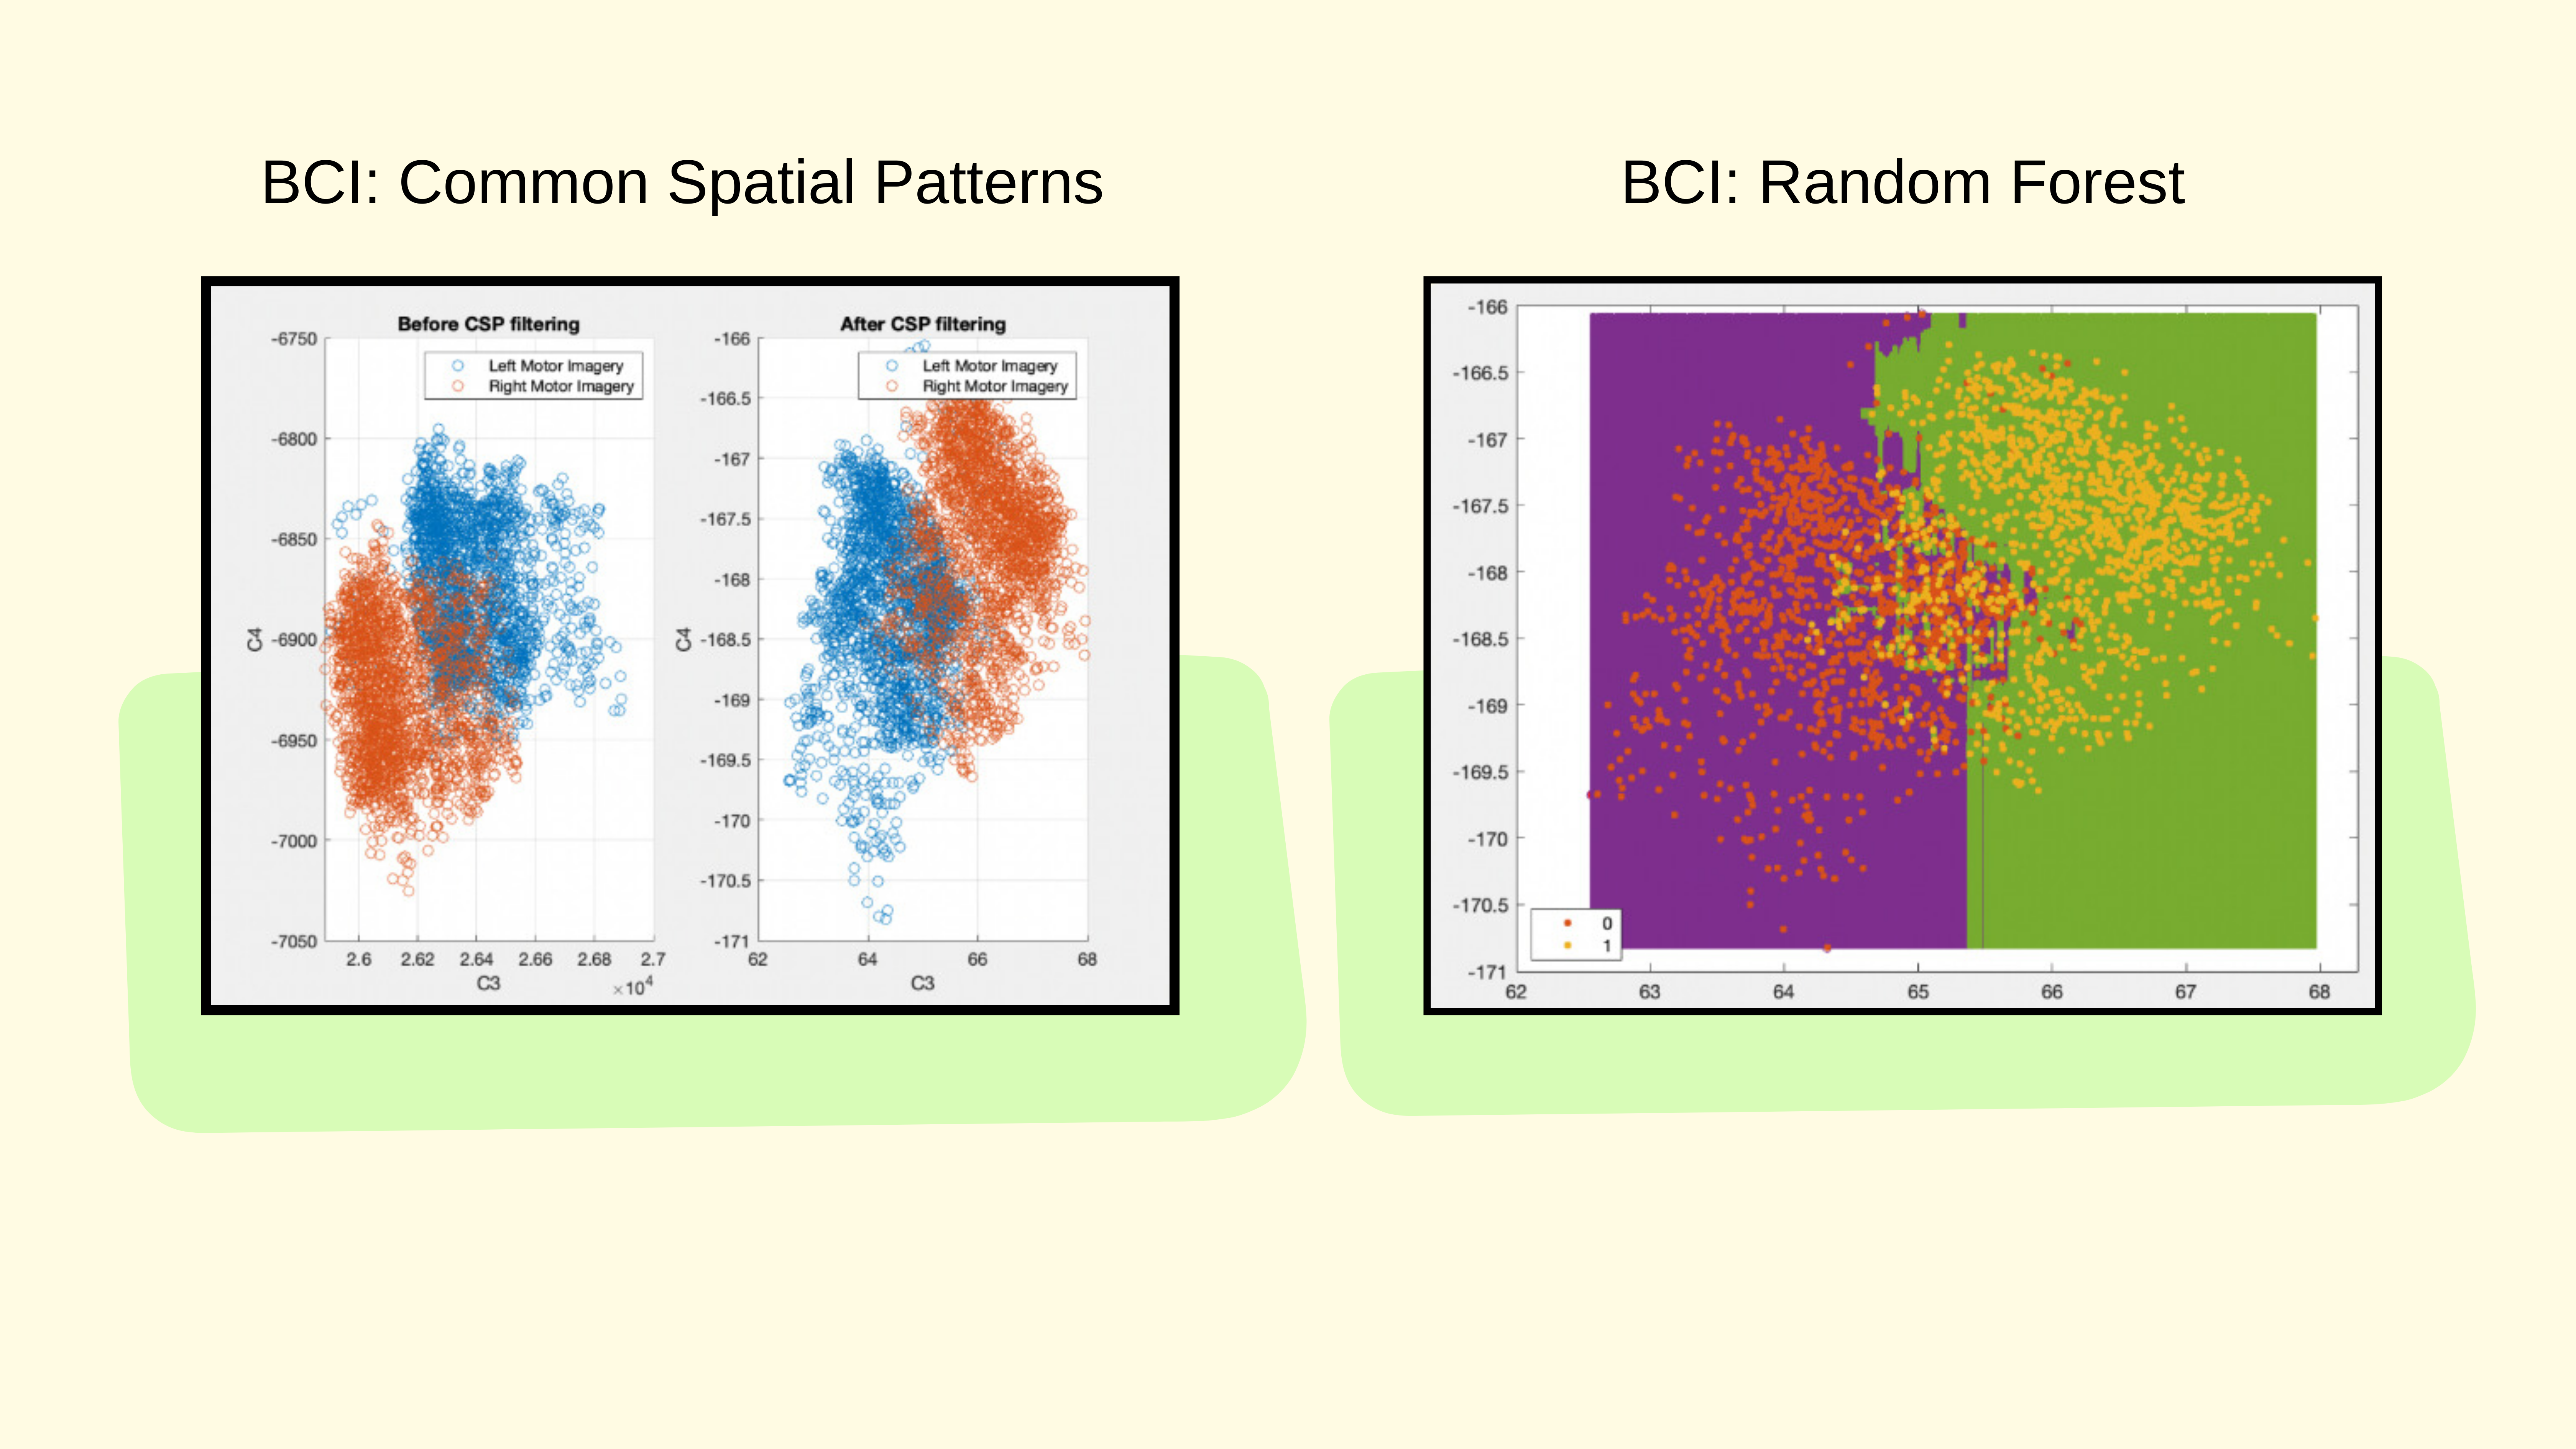
Common Spatial Patterns (CSP) efficiently extracts key features from EEG signals by separating brain activity patterns associated with specific motor imagery tasks, such as imagining left- or right-hand movements. These spatially filtered features enhance the signal's discriminability, making them ideal for classification.
The processed features are then fed into a Random Forest classifier, which uses multiple decision trees to predict the user’s intended action. Each tree votes on a potential classification, and the collective result determines the final output. This combination of CSP and Random Forest ensures precise interpretation of brain signals which enables real-time device control with high accuracy and minimal latency.
The Tide Band
Neo Presentation, 2024
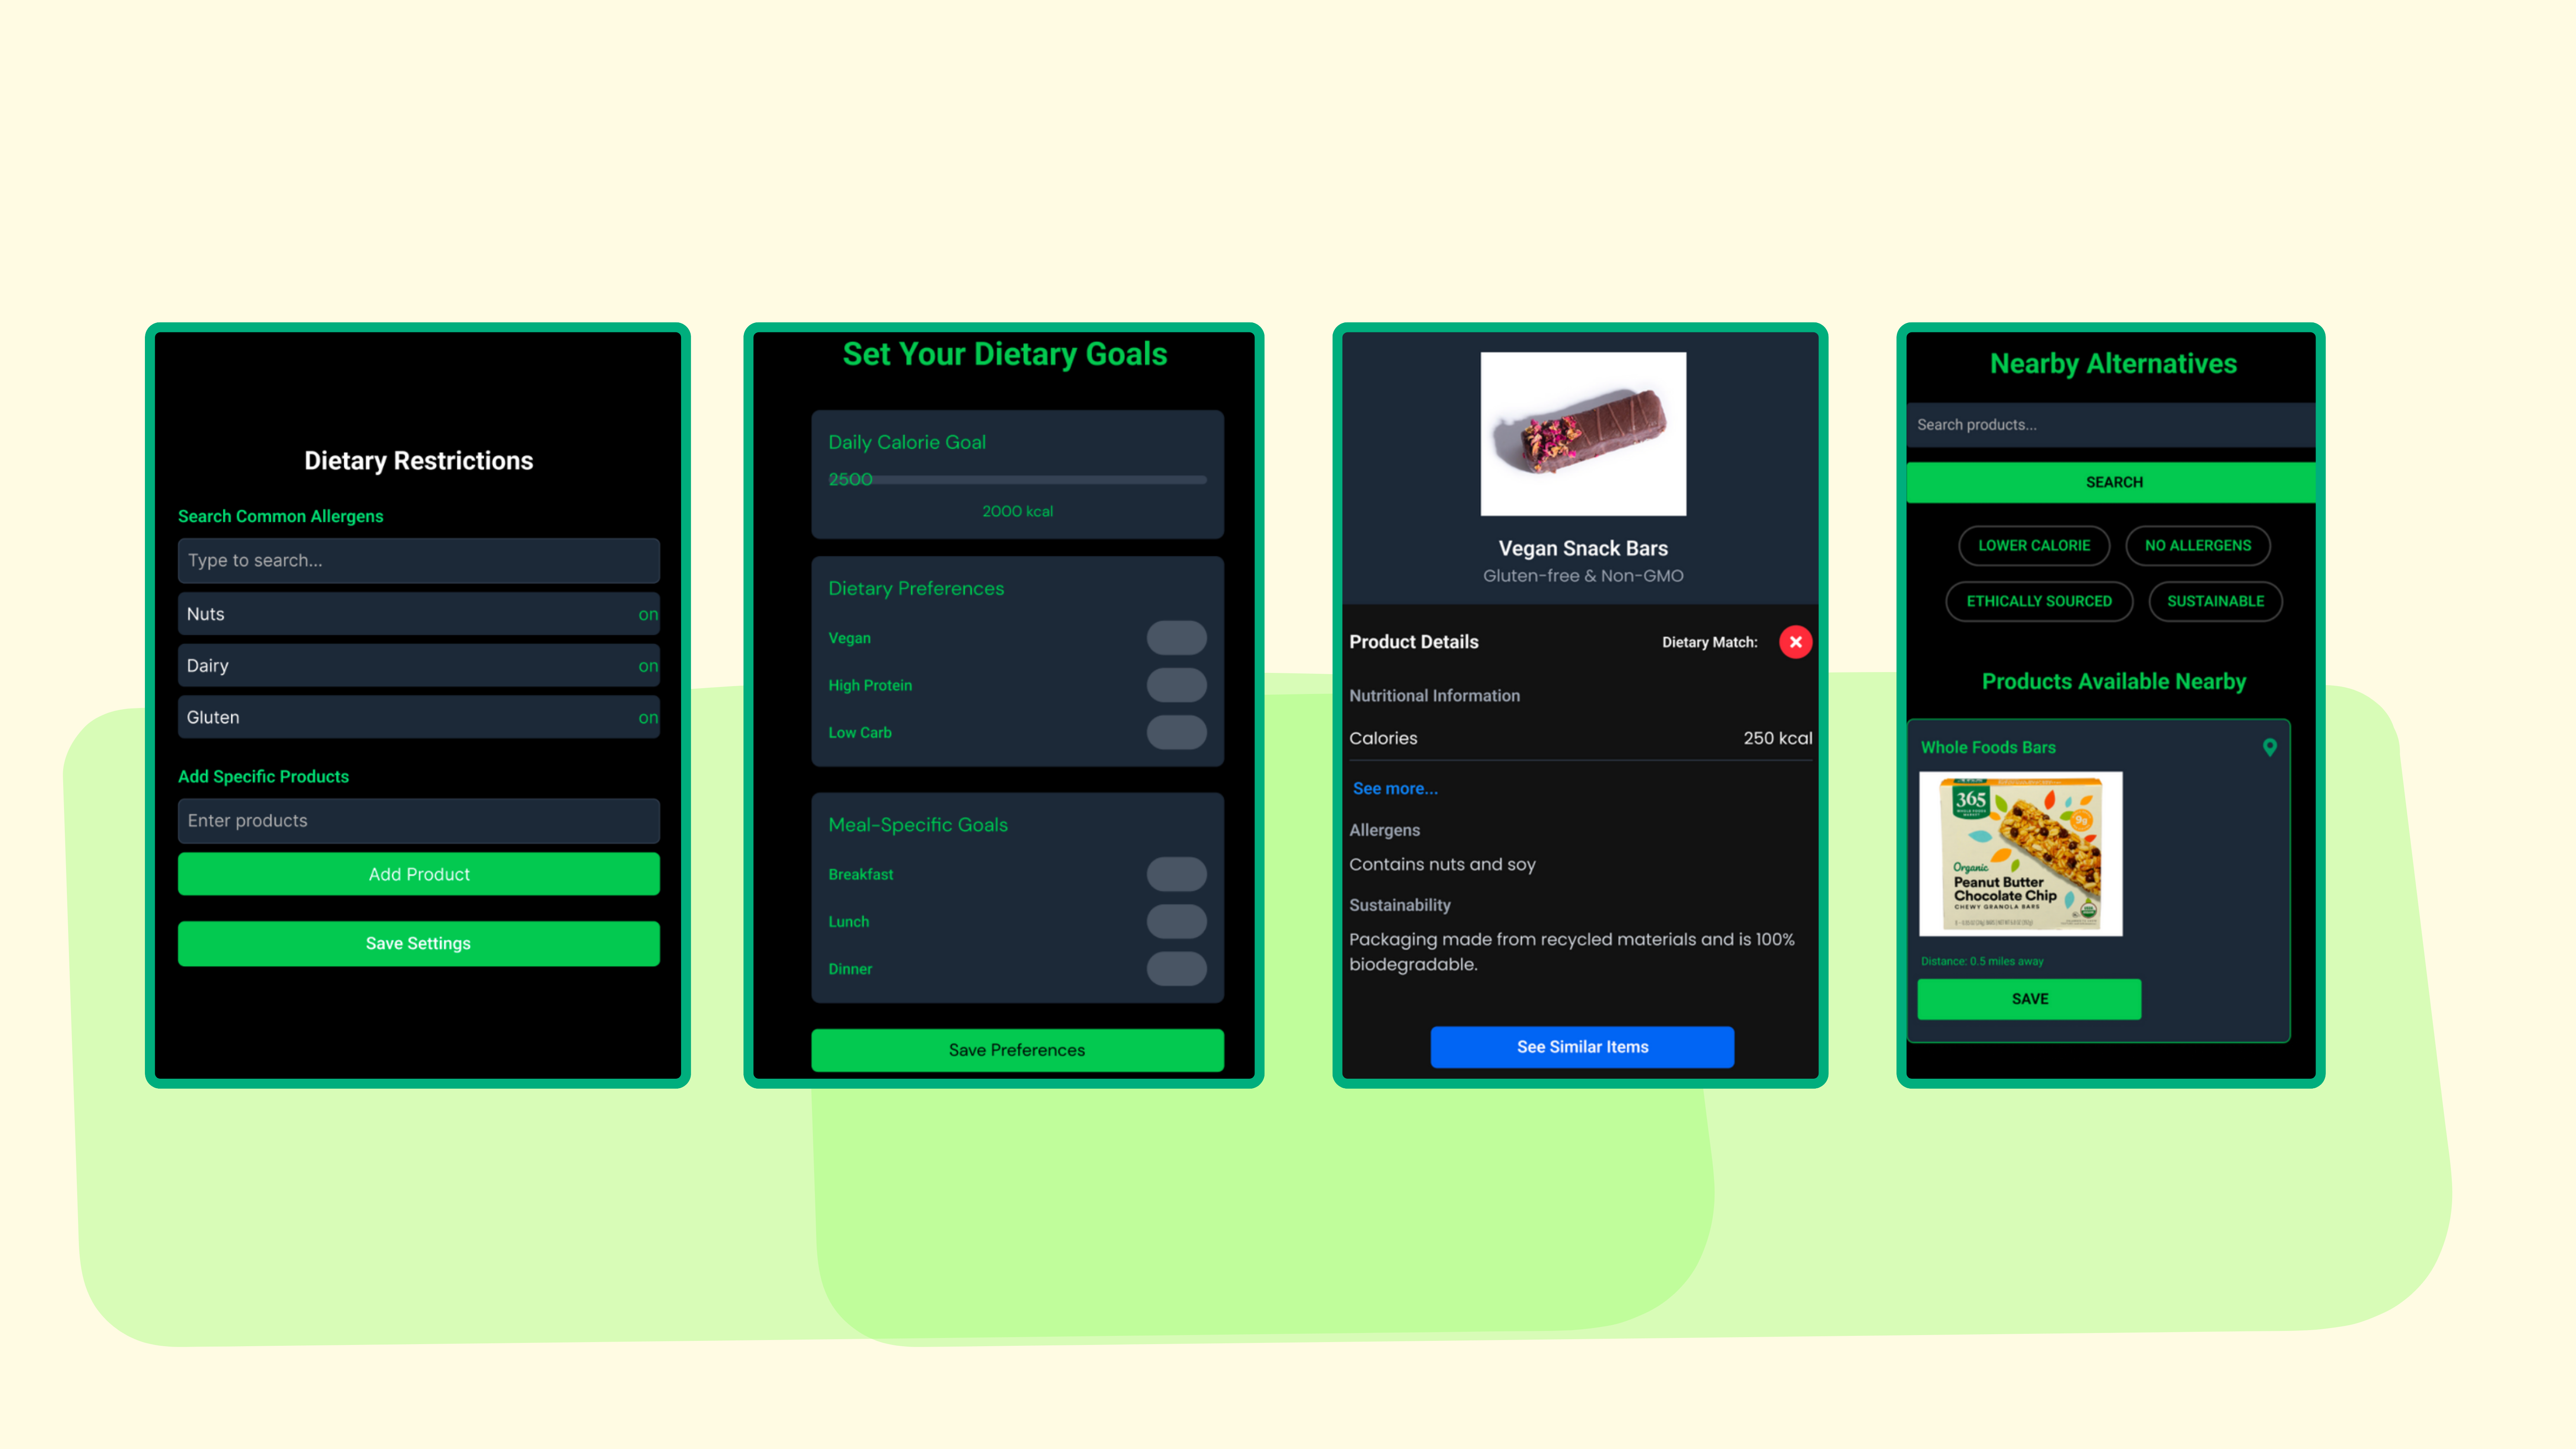
Tide Band is a wearable device, that enables users to make informed decisions on the spot by scanning product labels or menus and instantly determining compatibility with their dietary restrictions and preferences. Users can first input restricted foods, such as allergens or specific dietary requirements, and then set personalized meal-specific goals. Using advanced computer vision, Tide Band interprets text from scanned images to cross-reference user inputs with product information, offering a simple green or red light feedback system whether the food fits the criteria.
Tide Band also helps to build a robust database to create a comprehensive repository of allergens, nutritional metrics, and sustainable food options. It works directly with supply chains, leveraging its database and user feedback to encourage transparency, improve labeling standards, and promote sustainable sourcing practices.
chAIr
Expansion, 2024
ChAIr combines pressure sensors and computer vision to monitor and improve posture. Pressure sensors placed along key points of a chair record the user's back pressure distribution, while a deep neural network processes this data to assess posture quality. When poor posture is detected, the user is notified in real time.
The system leverages a Multilayer Perceptron (MLP) trained on data from four pressure sensors to evaluate how hunched the user is. The MLP processes sensor input continuously, outputting -1 for proper posture and values from 0 to 3 to indicate the specific area of the spine experiencing the most significant issue. This targeted feedback allows users to correct their posture effectively and prevent long-term spinal strain.
Earth Measurement Systems
Signature Curves
June, 2024
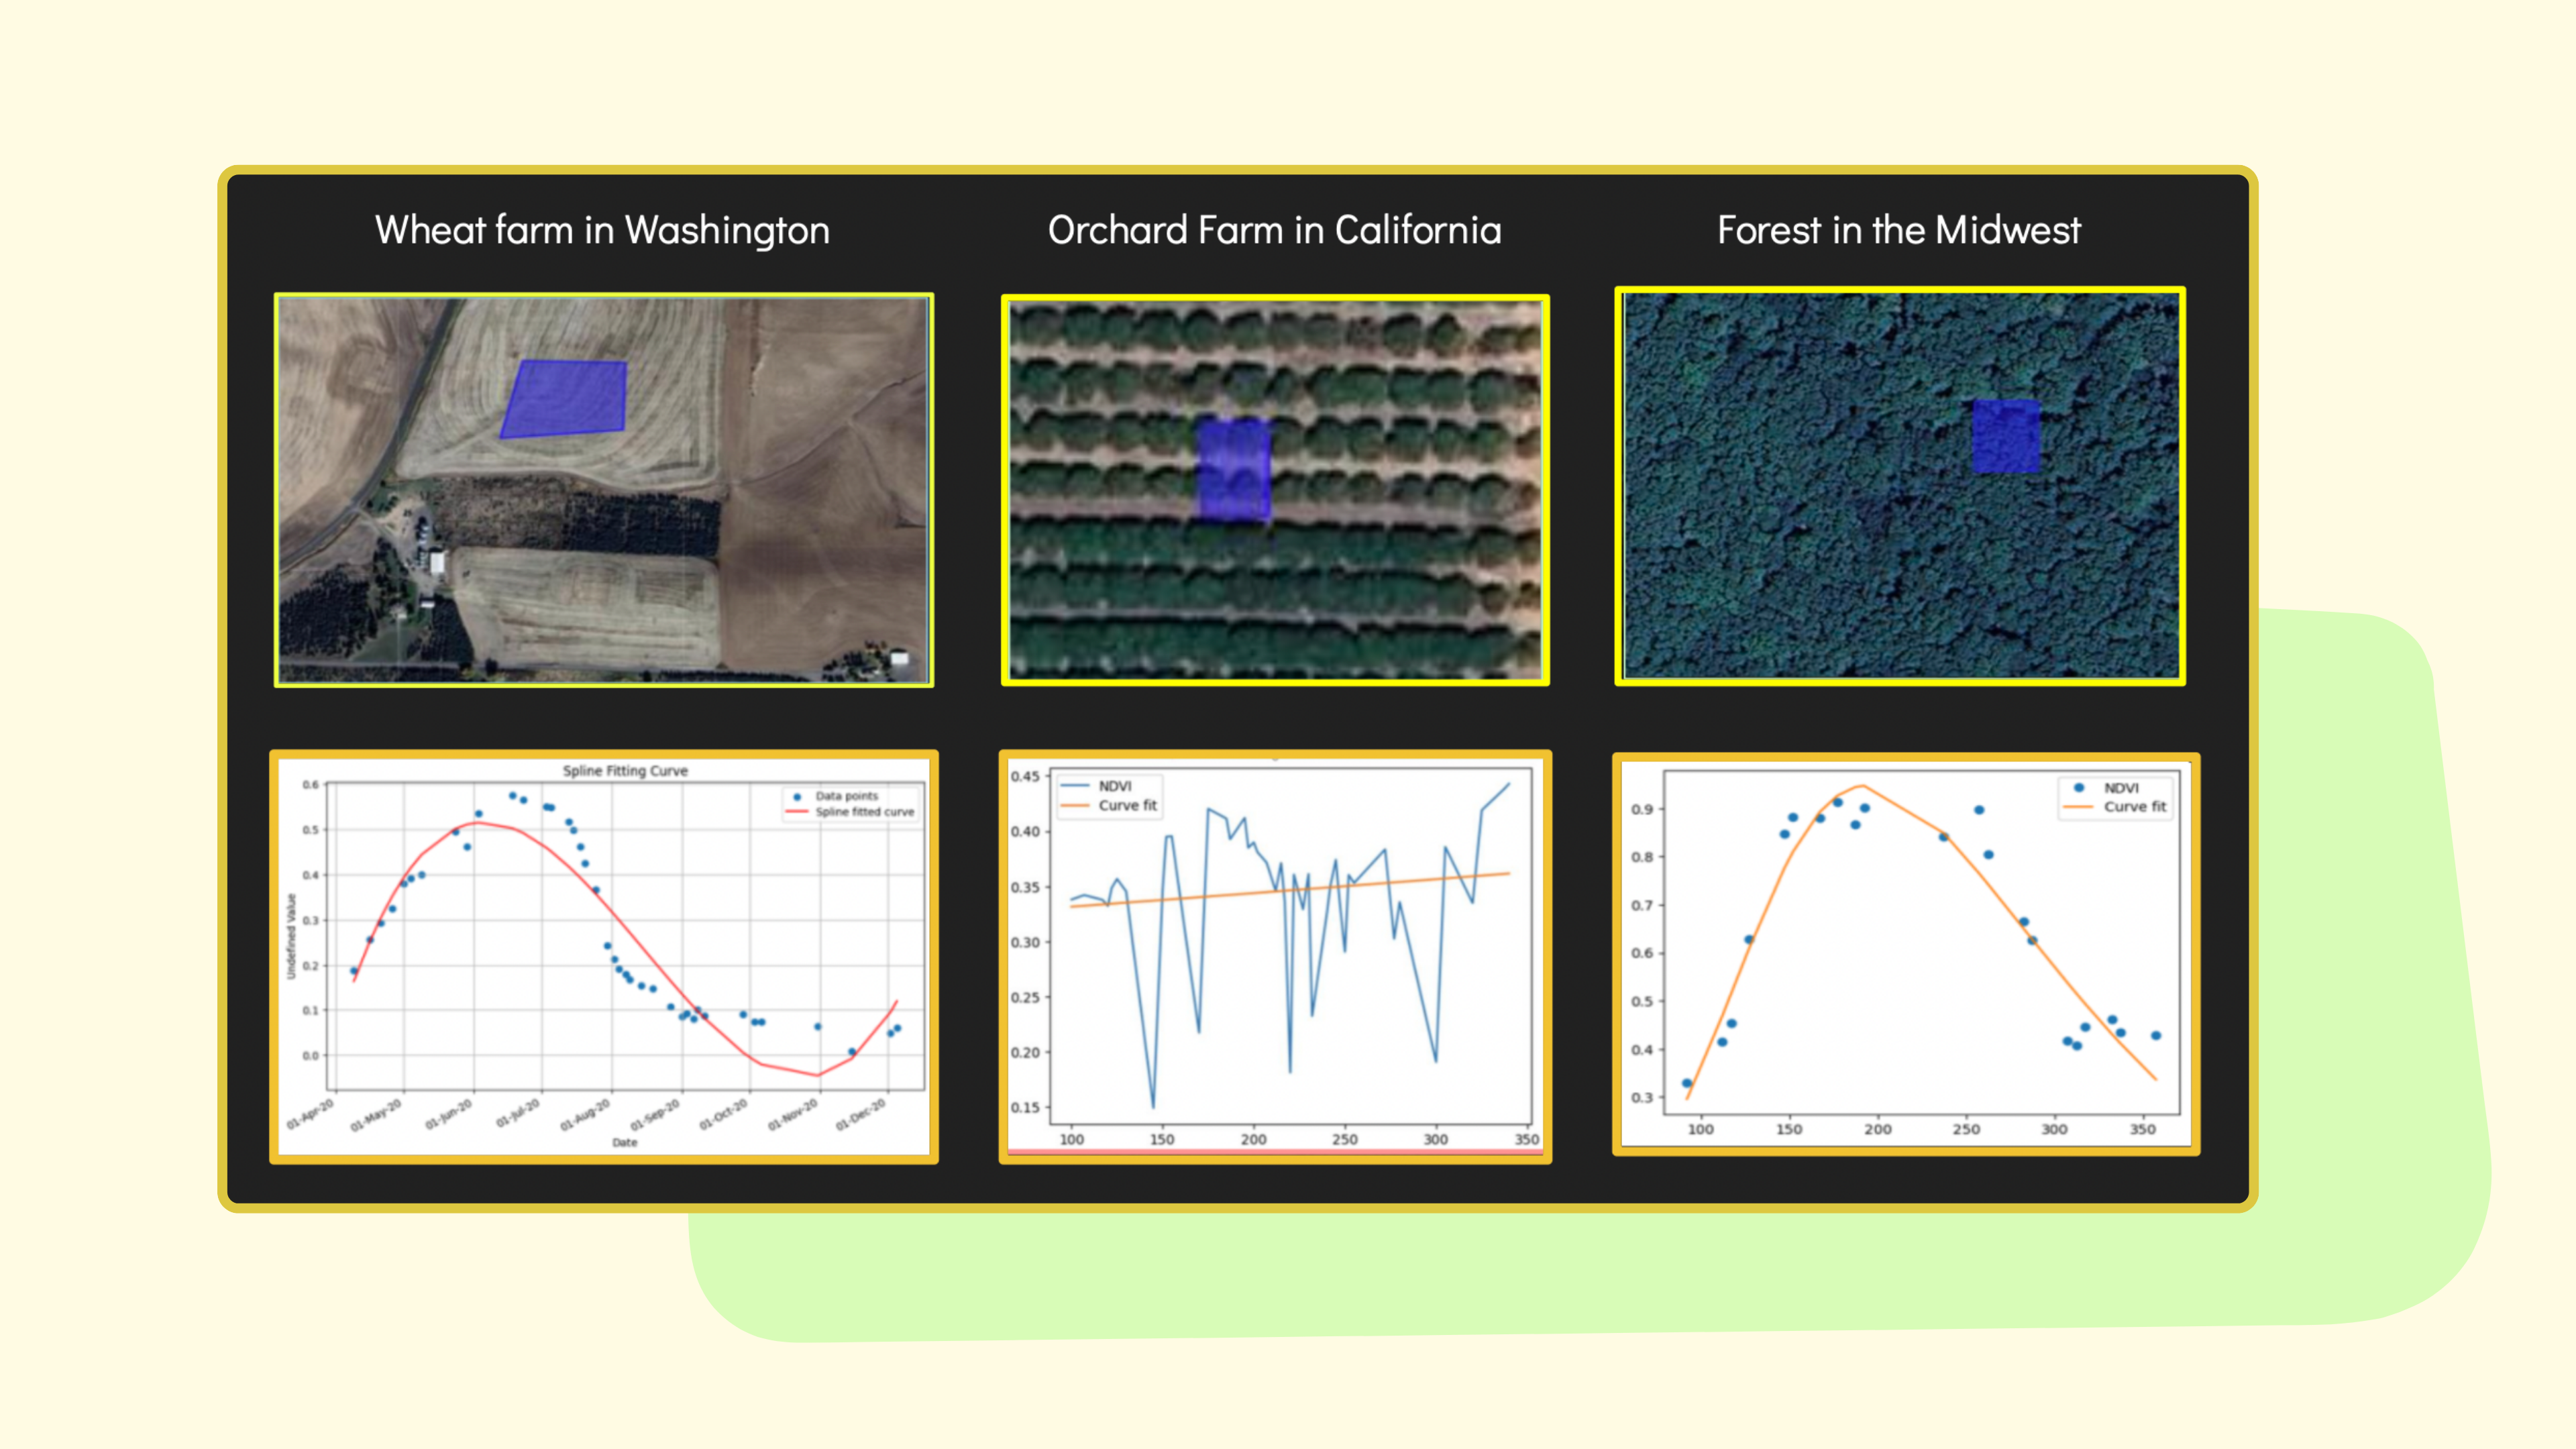
Signature curves are unique temporal patterns of Normalized Difference Vegetation Index (NDVI) that reflect the growth cycles and agricultural practices of specific crops. Derived from satellite data, these curves enable differentiation between farms, orchards, and forests, which often appear visually similar in remote sensing.
By leveraging these curves, TerraTrace can classify land use, track deforestation, and monitor vegetation changes over time.
TerraTrace
August, 2024
TerraTrace is an AI-driven platform designed to analyze and classify land use by leveraging the temporal patterns in NDVI data. It utilizes a dataset of over 70 million NDVI points for California, developed to track historical vegetation changes with high spatial and temporal precision. By analyzing unique NDVI signature curves, TerraTrace distinguishes between crops, orchards, and forests.
The platform offers an interactive interface where users can input geographic coordinates to generate NDVI curves and gain insights into vegetation trends and land use changes. With low computational overhead, it supports applications ranging from deforestation monitoring to regulatory compliance and climate adaptation.
Quantifying Structural Cracks in Buildings
May, 2022
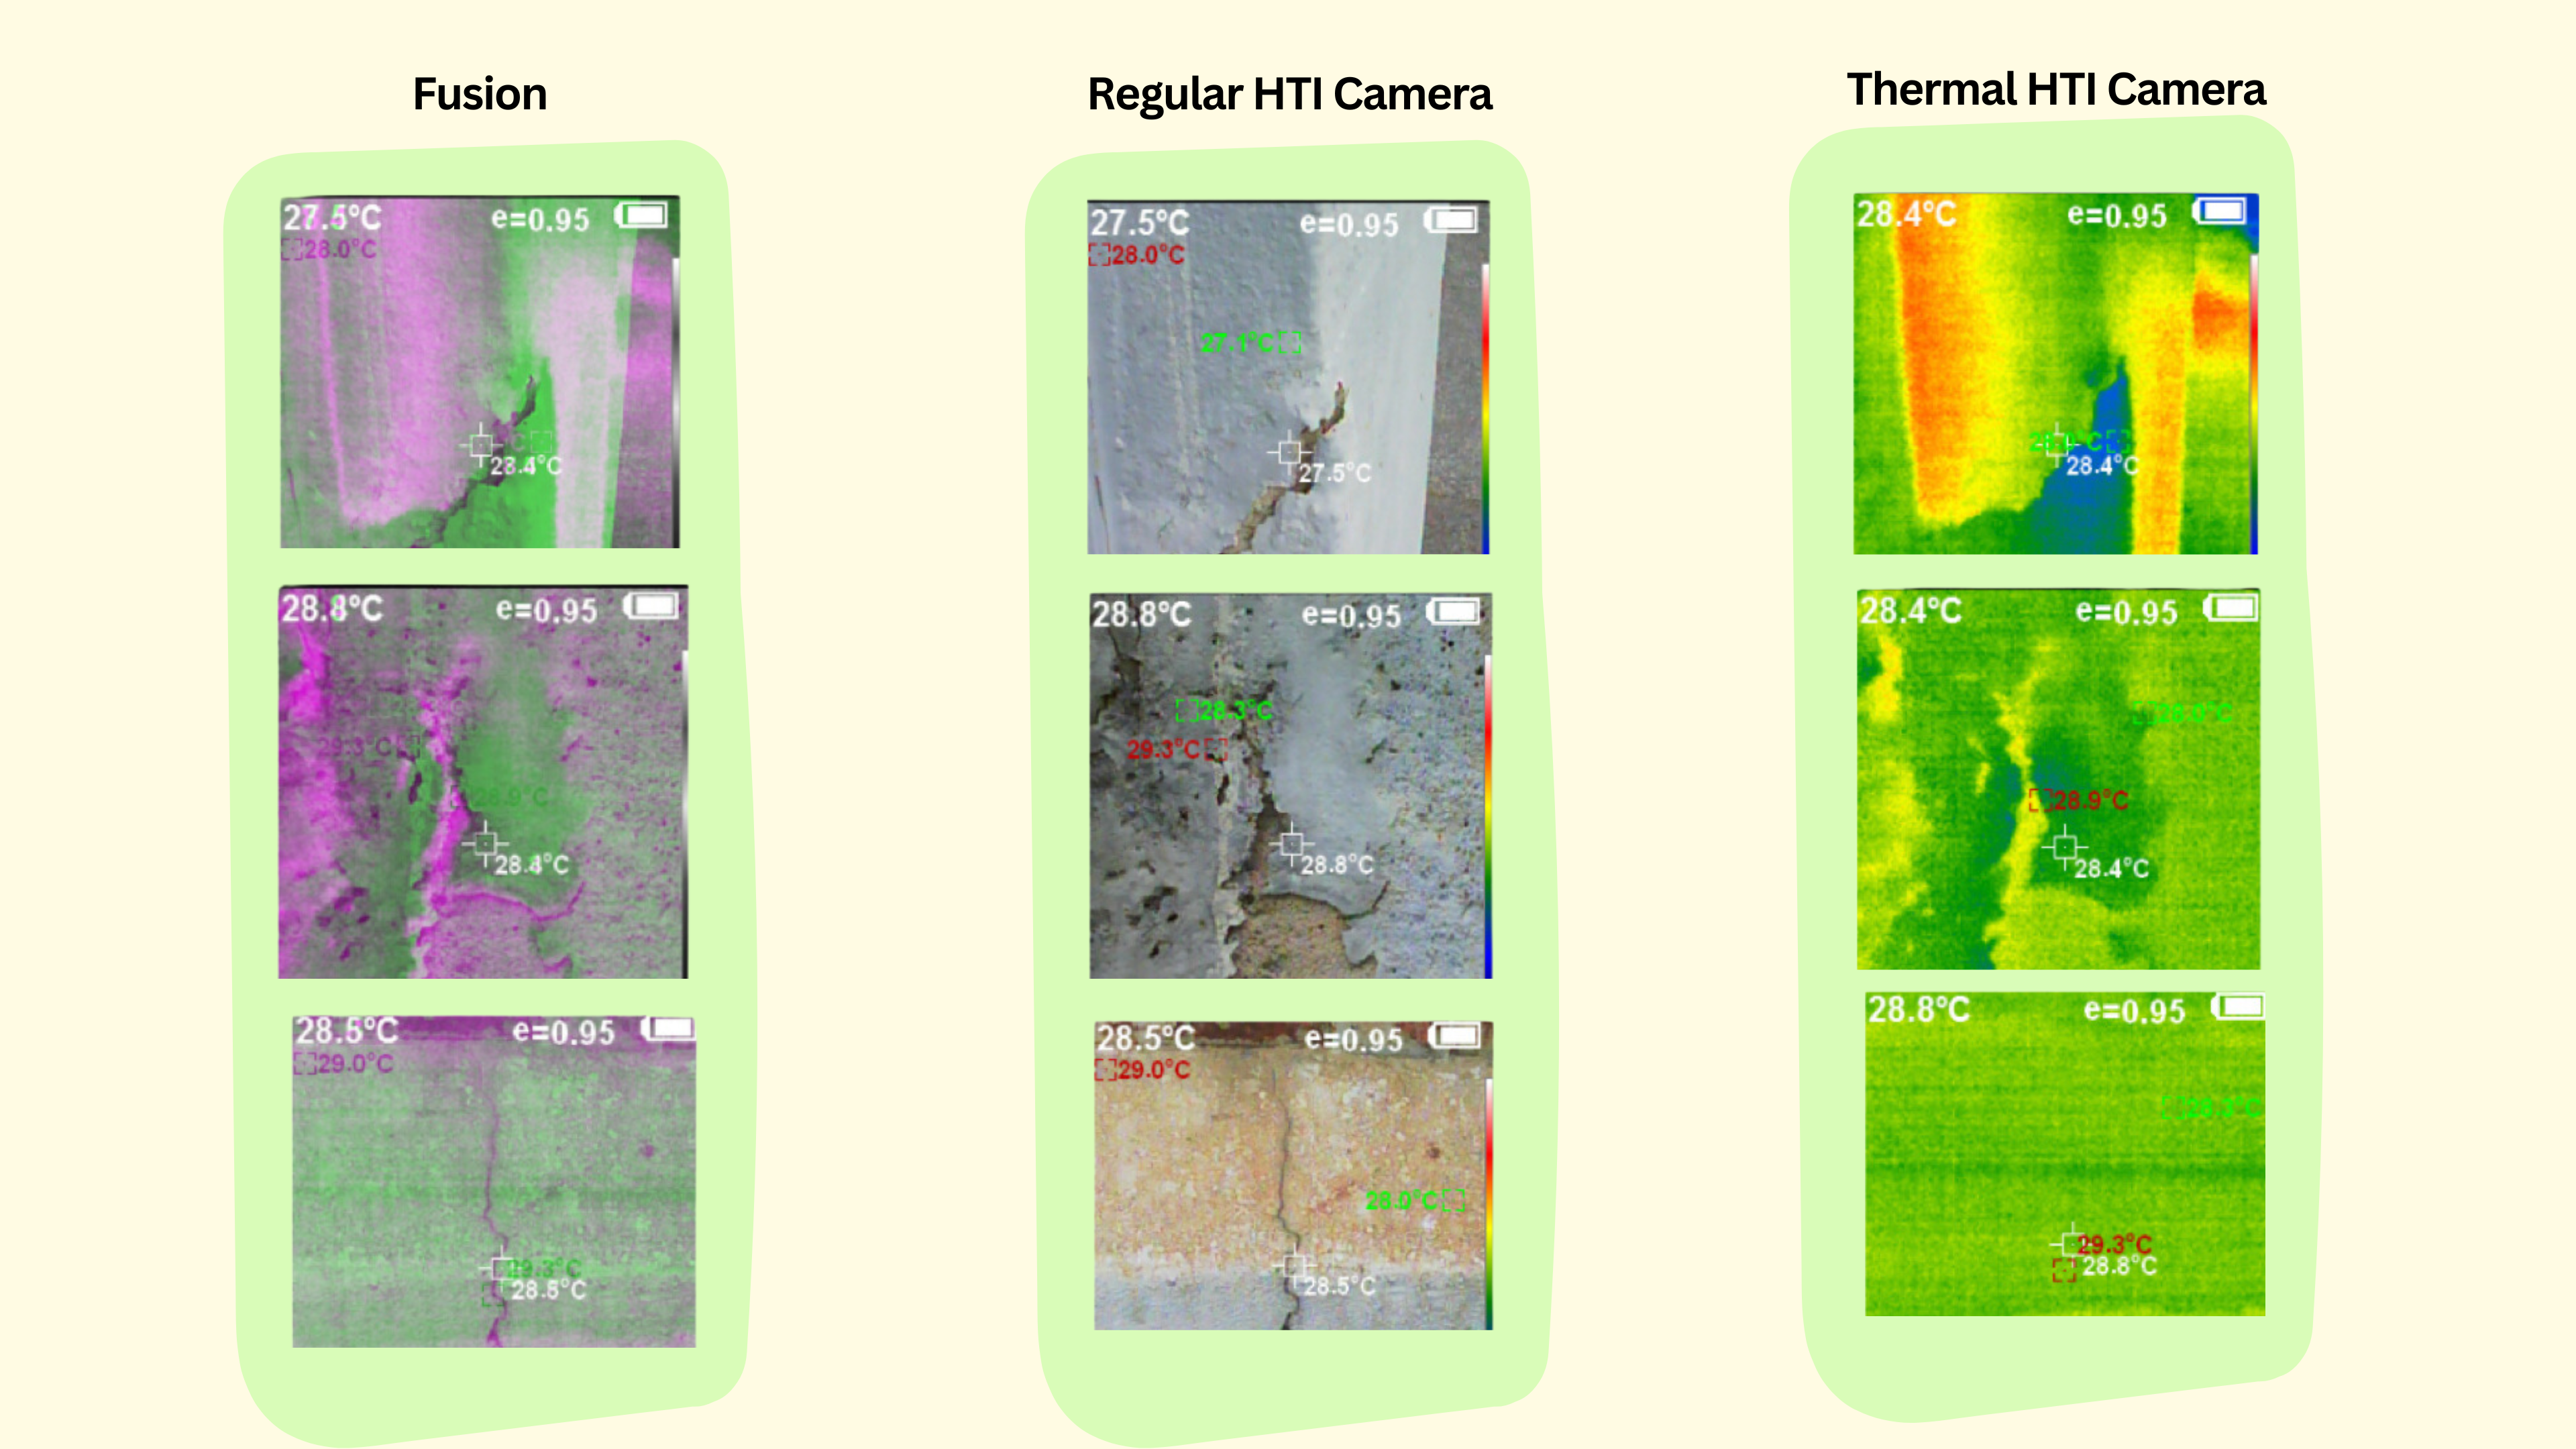
Cracks in buildings are key indicators of structural issues and sustainability challenges. Infrared thermography, combined with machine learning (ML), enhances crack detection by analyzing temperature differences. The process involves capturing images with thermal cameras, processing them to enhance clarity, and classifying cracks based on their severity.
Data collection begins with tools like HTI HT-18 and FLIR One Pro cameras to capture thermal and conventional images. These images undergo preprocessing steps such as fusion and noise reduction to improve quality.
Detection of Cracks in Buildings
April, 2023
The model for crack detection is built on a deep convolutional neural network (DCNN) framework, designed to classify cracks into three severity levels based on temperature variations. The DCNN processes features such as crack shape and temperature differences to identify and categorize pathologies. The network's architecture includes multiple layers for feature extraction and classification.
The model training employs an 80-20 split for training and validation, optimizing its ability to classify cracks accurately. Performance is evaluated using metrics like precision, recall, and F1 score, with the model achieving over 96% accuracy in distinguishing crack severity levels.